signal strength 1 of 5
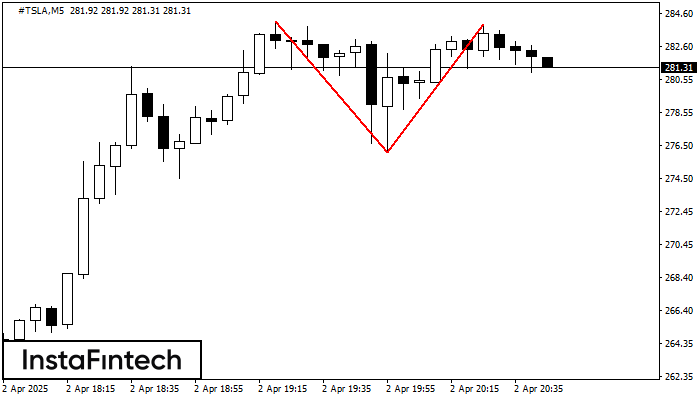
The Double Top pattern has been formed on #TSLA M5. It signals that the trend has been changed from upwards to downwards. Probably, if the base of the pattern 276.07 is broken, the downward movement will continue.
The M5 and M15 time frames may have more false entry points.
Xem thêm
- All
- Double Top
- Flag
- Head and Shoulders
- Pennant
- Rectangle
- Triangle
- Triple top
- All
- #AAPL
- #AMZN
- #Bitcoin
- #EBAY
- #FB
- #GOOG
- #INTC
- #KO
- #MA
- #MCD
- #MSFT
- #NTDOY
- #PEP
- #TSLA
- #TWTR
- AUDCAD
- AUDCHF
- AUDJPY
- AUDUSD
- EURCAD
- EURCHF
- EURGBP
- EURJPY
- EURNZD
- EURRUB
- EURUSD
- GBPAUD
- GBPCHF
- GBPJPY
- GBPUSD
- GOLD
- NZDCAD
- NZDCHF
- NZDJPY
- NZDUSD
- SILVER
- USDCAD
- USDCHF
- USDJPY
- USDRUB
- All
- M5
- M15
- M30
- H1
- D1
- All
- Buy
- Sale
- All
- 1
- 2
- 3
- 4
- 5

The Triple Bottom pattern has formed on the chart of GOLD M15. Features of the pattern: The lower line of the pattern has coordinates 3314.04 with the upper limit 3314.04/3308.41
The M5 and M15 time frames may have more false entry points.
Открыть график инструмента в новом окне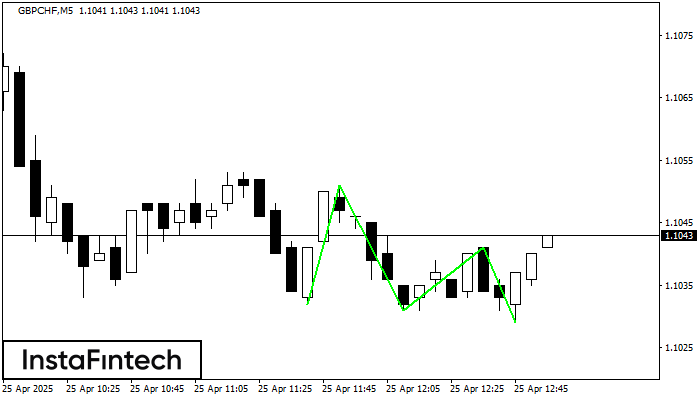
The Triple Bottom pattern has been formed on GBPCHF M5. It has the following characteristics: resistance level 1.1051/1.1041; support level 1.1032/1.1029; the width is 19 points. In the event
The M5 and M15 time frames may have more false entry points.
Открыть график инструмента в новом окне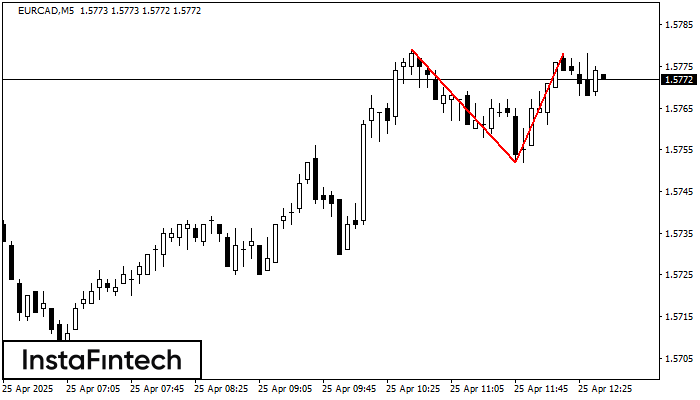
On the chart of EURCAD M5 the Double Top reversal pattern has been formed. Characteristics: the upper boundary 1.5778; the lower boundary 1.5752; the width of the pattern 26 points
The M5 and M15 time frames may have more false entry points.
Открыть график инструмента в новом окне