signal strength 1 of 5
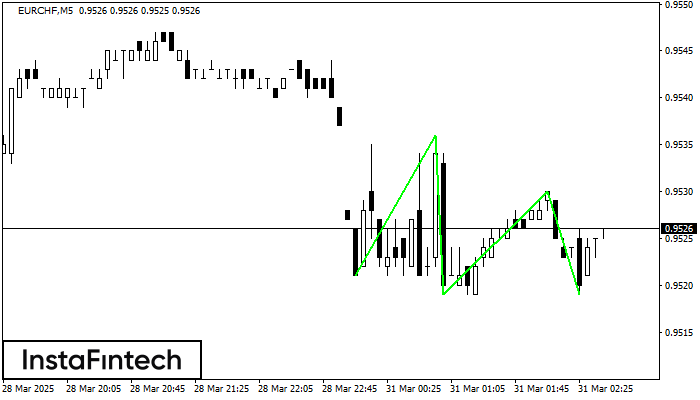
The Triple Bottom pattern has formed on the chart of EURCHF M5. Features of the pattern: The lower line of the pattern has coordinates 0.9536 with the upper limit 0.9536/0.9530, the projection of the width is 15 points. The formation of the Triple Bottom pattern most likely indicates a change in the trend from downward to upward. This means that in the event of a breakdown of the resistance level 0.9521, the price is most likely to continue the upward movement.
The M5 and M15 time frames may have more false entry points.
Xem thêm
- All
- Double Top
- Flag
- Head and Shoulders
- Pennant
- Rectangle
- Triangle
- Triple top
- All
- #AAPL
- #AMZN
- #Bitcoin
- #EBAY
- #FB
- #GOOG
- #INTC
- #KO
- #MA
- #MCD
- #MSFT
- #NTDOY
- #PEP
- #TSLA
- #TWTR
- AUDCAD
- AUDCHF
- AUDJPY
- AUDUSD
- EURCAD
- EURCHF
- EURGBP
- EURJPY
- EURNZD
- EURRUB
- EURUSD
- GBPAUD
- GBPCHF
- GBPJPY
- GBPUSD
- GOLD
- NZDCAD
- NZDCHF
- NZDJPY
- NZDUSD
- SILVER
- USDCAD
- USDCHF
- USDJPY
- USDRUB
- All
- M5
- M15
- M30
- H1
- D1
- All
- Buy
- Sale
- All
- 1
- 2
- 3
- 4
- 5
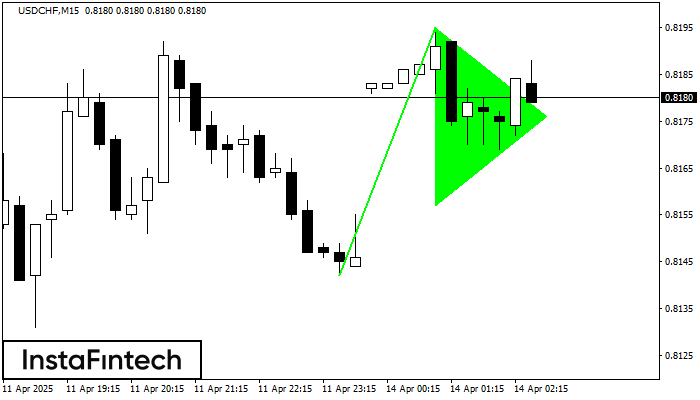
Tín hiệu Cờ hiệu tăng - Công cụ giao dịch USDCHF M15, mô hình tiếp tục. Dự đoán: có thể thiết lập vị trí mua trên
Khung thời gian M5 và M15 có thể có nhiều điểm vào lệnh sai hơn.
Open chart in a new window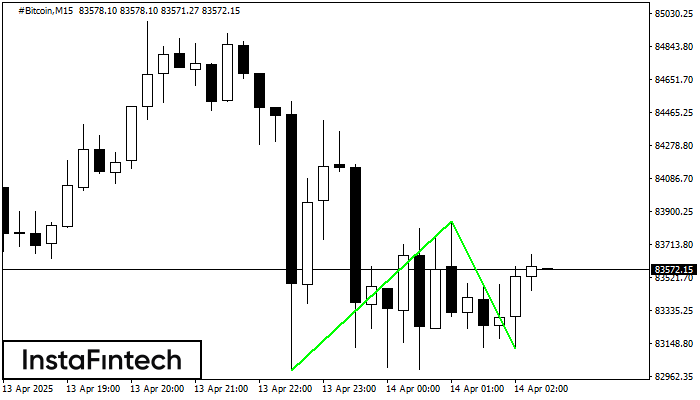
Mô hình Đáy đôi đã được hình thành trên #Bitcoin M15; đường viền trên là 83846.39; đường viền dưới là 83118.34. Độ rộng của mô hình là 85123 điểm. Trong
Khung thời gian M5 và M15 có thể có nhiều điểm vào lệnh sai hơn.
Open chart in a new window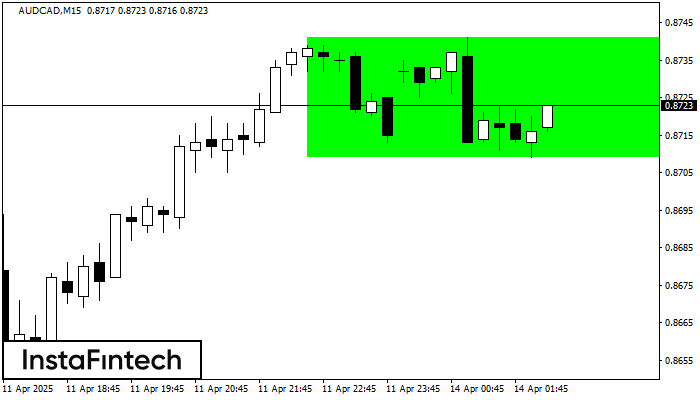
Theo biểu đồ của M15, AUDCAD đã tạo thành Hình chữ nhật tăng. Loại mô hình này cho thấy sự tiếp tục xu hướng
Khung thời gian M5 và M15 có thể có nhiều điểm vào lệnh sai hơn.
Open chart in a new window