empty
06.10.2021 07:35 AM
How to use technical indicators when trading ETH/USD

Ether is currently the second-largest digital currency by market capitalization after bitcoin. Many experts think that ether has far more advantages than bitcoin. Yet, one should choose completely different strategies when trading these digital assets despite some similar features between them. The growth rate of ether is significantly higher compared to bitcoin. It is associated with different groups of traders that buy these altcoins. Support levels in the crypto market are formed in another way as well as breakouts of resistance levels. However, to start trading ETH/USD, it is necessary to use familiar technical indicators on the horizontal charts.

The Relative Strength Index (RSI) is a technical indicator that allows traders to determine the force of a trend (descending or ascending) and foresee possible changes in the price movement. Thanks to this indicator, it is possible to identify at what level an asset will become overbought or oversold. The optimal level for this indicator is 60 if we need a bullish trend. It indicates a high demand for the coin and the strength of the current upward momentum. When crossing this level, the digital asset begins to move to the overbought zone.

The moving average convergence divergence (MACD) is a popular technical momentum indicator that helps traders draw certain conclusions about the trend based on the movement of moving averages and the relation between the two moving averages. It signals bullish momentum when the intersection of the white line under the red occurs. It indicates bearish momentum when the white line from above crosses the red.

A stochastic Oscillator, also referred to as a Stochastic Indicator, is a momentum indicator that helps determine the direction of the prevailing trend. If the indicator is above the 80 level, then the asset is overbought. If it is below 20, then the asset is oversold.

Notably, demand for ether among retail traders is growing thanks to several reasons. Firstly, it is not as institutionalized as BTC, which helps ether lesser dependence on the flows of large capital. In addition, the speed and security of transactions on the ETH network are much better than that of bitcoin. The recent London hard fork update has significantly reduced the size of commissions, attracting a large number of individual traders. The main advantage of ether is a developed ecosystem that allows using the capabilities of the DeFi and NFT market. Ether managed to increase transaction volumes by 260% amid these developments.

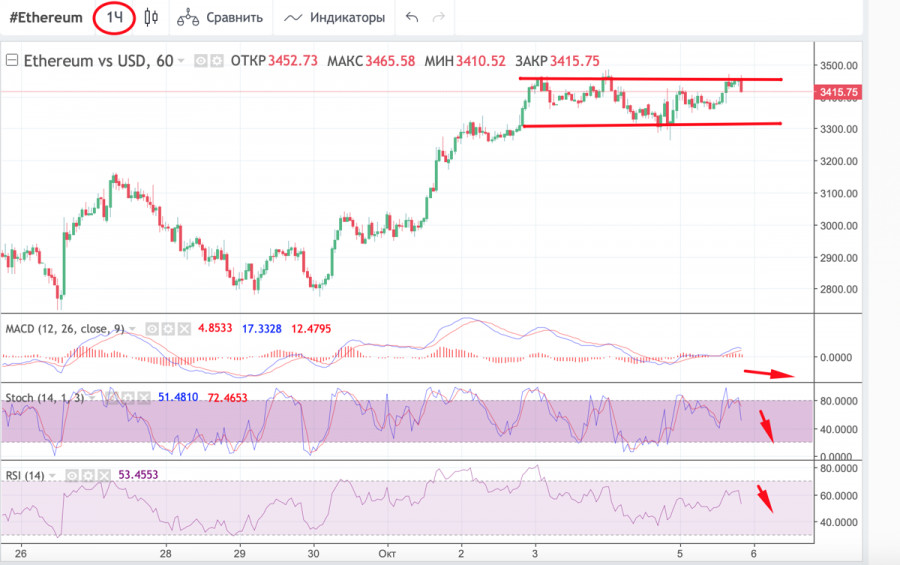
As of October 5, ETH/USD was trading at $3,400. Analysts are sure that ether is likely to reach a new all-time high amid positive sentiment in the crypto market. Analysis of technical charts helps you to determine the main trend of the cryptocurrency by looking at what level it is located. Technical indicators may also provide clues on how long it takes for the digital asset to reach a new high. The 1H chart shows that the altcoin has been consolidating since early October. It struggles to break through the $3,500 level due to a big number of short positions orders after the recent market collapse.

The $3,500 level is the lower limit of the resistance zone, which ends after the digital asset reaches $3,650. When the cryptocurrency breaks out of this area, an upward movement will begin to the next resistance level near $4,000. On the 1H chart, technical indicators signal a downward movement. The stochastic oscillator shows a strong bearish signal. It fell below the 50 mark. The MACD indicator is also close to forming a bearish intersection, which indicates the weakness of bulls. It seems that traders stick to the wait-and-see approach.
This image is no longer relevant

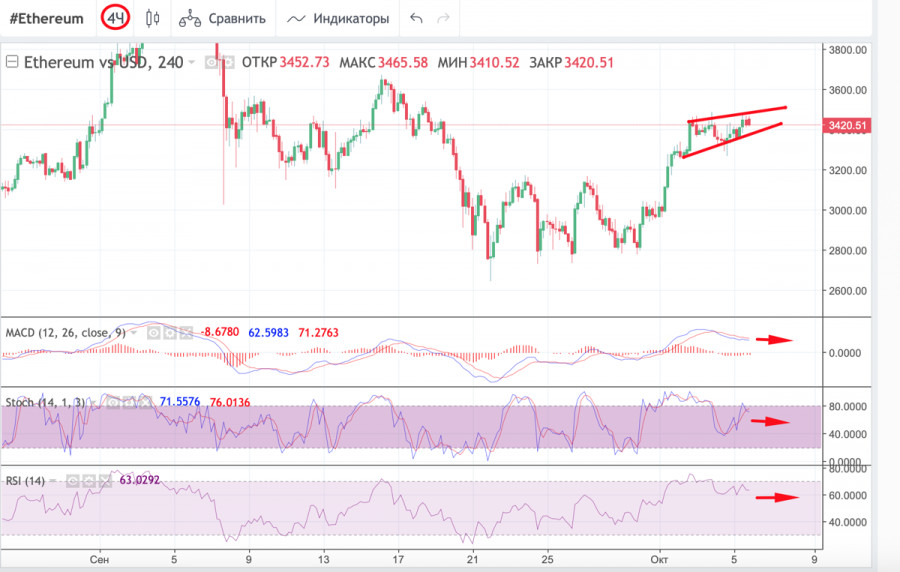
On the 4H chart, the indicators have stabilized. They signal the accumulation phase, which may lead to a possible breakout of $3,500 tonight. However, traders are concerned by the formation of a bearish wedge on the charts, which may indicate a decline. This is why the virtual asset is unlikely to break through the $3,500 mark. It means that the altcoin will remain within the accumulation zone. At the same time, the MACD and the RSI index are moving sideways, which indicates the absence of strong bullish or bearish momentum. However, taking into account the formation of a bearish figure, bears are likely to gain momentum. Stochastic continues to move up. At the same time, it signals the weakness of the bullish momentum and the formed bullish intersection is unlikely to change the situation.

This image is no longer relevant

A wedge pattern can signal either bullish or bearish price reversals on the horizontal charts. It indicates that the price has reached local highs followed by a further price drop or trend reversal.

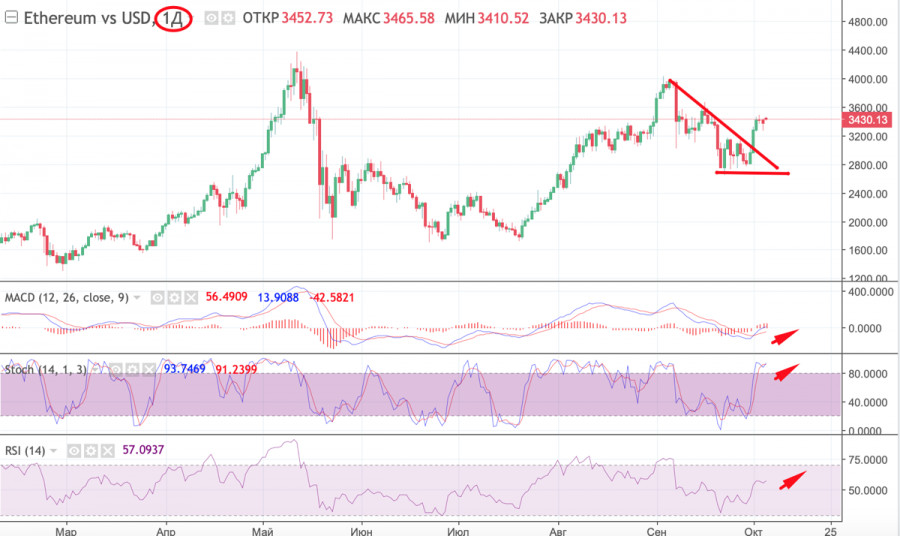
The bearish triangle or descending triangle is a bearish formation on the horizontal charts that anticipates a downside breakout. Ascending triangles are a bullish formation that anticipates an upside breakout.

On the daily chart, ETH/USD went beyond the bearish triangle. Now, the price is trying to consolidate above this zone. however, the dominance of bears can be seen on smaller timeframes. However, the technical indicators show that the consolidation phase is coming to an end. The MACD indicator has entered the red zone. Yet, it continues to grow, as does the stochastic, which has formed a bullish intersection. It is moving above the 80 mark. At the same time, the RSI indicator began a sideways movement along the 60 mark. It signals a possible strengthening of the current bullish momentum. However, in general, technical indicators show a correctional phase that will begin in the near future. After the correctional phase, the price will try to break above $3,500. It may rise on October 6. So, it is recommended to open long traders on ETH with prospects of growth above $4,000.

This image is no longer relevant

เลือกช่วงเวลา
5
นาที
15
นาที
30
นาที
1
ชั่วโมง
4
ชั่วโมง
1
วัน
1
สัปดาห์
รับผลกำไรจากการเปลี่ยนแปลงอัตราสกุลเงินดิจิทัลกับ InstaForex.
ดาวน์โหลด MetaTrader 4 และเปิดการซื้อขายครั้งแรกของคุณ.
USD/JPY: การวิเคราะห์และการคาดการณ์ เงินเยนของญี่ปุ่นยังคงมีแนวโน้มเชิงบวก แม้จะมีอุปสรรคบางอย่าง และยังคงเป็นจุดสนใจหลักเมื่อความกังวลเกี่ยวกับความเสี่ยงทั่วโลกที่ปรับตัวสูงขึ้นช่วยกระตุ้นความต้องการสินทรัพย์ปลอดภัย ความหวังที่ลดลงในการแก้ไขข้อขัดแย้งทางการค้าระหว่างสหรัฐฯ กับจีนอย่างรวดเร็ว ประกอบกับความคาดหวังว่าอาจจะมีข้อตกลงระหว่างญี่ปุ่นกับสหรัฐฯ และความคาดหวังที่เพิ่มขึ้นว่าธนาคารกลางญี่ปุ่น (BoJ) อาจจะขึ้นอัตราดอกเบี้ย ล้วนสนับสนุนความต้องการเงินเยน นอกจากนี้ การทวีความแตกต่างของนโยบายระหว่างธนาคารกลางสหรัฐฯ กับ BoJ ยังเพิ่มแรงกดดันให้กับดอลลาร์สหรัฐ
  • Grand Choice
    Contest by
    InstaForex
    InstaForex always strives to help you
    fulfill your biggest dreams.
    เข้าร่วมการแข่งขัน


บทความแนะนำ

การวิเคราะห์ BTC/USD – 24 เมษายน: บิทคอยน์แสดงสัญญาณของการฟื้นตัว

รูปแบบคลื่นบนแผนภูมิ 4 ชั่วโมงสำหรับ BTC/USD ได้กลายเป็นซับซ้อนมากยิ่งขึ้น ก่อนหน้านี้เราได้สังเกตรูปแบบโครงสร้างปรับฐานอย่างลงที่เสร็จสิ้นการก่อตัวใกล้กับระดับ 75,000 ดอลลาร์ หลังจากนั้นก็มีการเคลื่อนไหวขาขึ้นที่แข็งแกร่งมากที่อาจเป็นจุดเริ่มต้นของแนวโน้มใหม่ ปัจจุบันคลื่นแรกดูเหมือนจะเสร็จสิ้นแล้ว ดังนั้นควรคาดหวังการแก้ไขคลื่น 2 หรือ b ในลำดับถัดไป

Chin Zhao 10:15 2025-04-24 UTC+2

คำแนะนำการซื้อขายสำหรับตลาดคริปโทเคอร์เรนซีในวันที่ 24 เมษายน

Bitcoin ไม่สามารถยืนที่ระดับเหนือ $94,000 ได้และมีการปรับฐานลงมาตรงพื้นที่ $92,500 ซึ่งดูเหมือนว่าจะสบายมากกว่า Ethereum ก็มีการถอยกลับมาที่ประมาณ $1,769 หลังจากที่ขึ้นไปอยู่เหนือระดับ $1,830 ในช่วงเวลาสั้น ๆ ในขณะเดียวกัน หลังจากที่

Miroslaw Bawulski 08:58 2025-04-24 UTC+2

บิทคอยน์อาจกลับมาเพิ่มขึ้นตามแนวโน้มเดิม

Bitcoin แสดงให้เห็นถึงการพุ่งขึ้นอย่างแข็งแกร่งเมื่อวานนี้ หลังจากทะลุระดับ $90,000 สกุลเงินดิจิทัลหลักก็ดีดตัวขึ้นไปทาง $94,000 ก่อนจะหยุดชั่วคราวชั่วครู่ Ether เองก็ได้รับผลประโยชน์ที่น่าประทับใจเช่นกัน หลังจากที่ซื้อขายอยู่ใกล้กับ $1,570 เมื่อวานนี้ ETH ก็ไปถึง $1,800

Jakub Novak 12:59 2025-04-23 UTC+2

คำแนะนำการซื้อขายสำหรับตลาดสกุลเงินดิจิทัลวันที่ 23 เมษายน

บิตคอยน์สามารถทำราคาทะลุเกิน $90,000 ได้สำเร็จ ขณะที่ Ethereum เพิ่มขึ้นมากกว่า 10% ในเพียงวันเดียว โดยทำให้กลับไปที่ $1800 อีกครั้ง ปัจจัยหลักที่ทำให้เกิดการเคลื่อนไหวครั้งนี้คือคำแถลงของโดนัลด์ ทรัมป์เมื่อวานนี้ โดยชี้แจงว่าการปลดเจอโรม พาวเวลล์ออกจากตำแหน่งประธานธนาคารกลางแห่งสหรัฐฯ

Miroslaw Bawulski 09:03 2025-04-23 UTC+2

การวิเคราะห์คู่ BTC/USD – วันที่ 22 เมษายน: ช่วงเวลาที่ต้องเผชิญความจริง

โครงสร้างของคลื่นในกราฟ 4 ชั่วโมงของ BTC/USD นั้นค่อนข้างชัดเจน หลังจากสิ้นสุดแนวโน้มขาขึ้นที่ประกอบด้วยคลื่นเต็มห้าความยาว มีคลื่นขาลงเริ่มก่อตัวซึ่งในขณะนี้ดูเหมือนจะเป็นการปรับฐาน ดังนั้นฉันจึงไม่ได้คาดหวังว่า Bitcoin จะขึ้นไปอยู่เหนือช่วง $110,000–$115,000 ในเดือนที่จะถึงนี้ ข่าวพื้นฐานได้สนับสนุน Bitcoin มานาน

Chin Zhao 11:49 2025-04-22 UTC+2

คำแนะนำการซื้อขายสำหรับตลาดคริปโตเคอร์เรนซีในวันที่ 22 เมษายน

บิทคอยน์กลับสู่โซน 88,000 ดอลลาร์ แต่ Ethereum กำลังเผชิญความท้าทาย การขายออกเมื่อวานนี้ในช่วงตลาดสหรัฐฯ ที่มีสาเหตุมาจากการลดลงของดัชนีหุ้นอเมริกา ถูกชดเชยด้วยการซื้อบิทคอยน์ ขณะที่ Ethereum ดูเหมือนไม่ได้รับความสนใจใกล้กับจุดต่ำสุดของมัน เห็นได้ชัดว่าในช่วงที่มีการพูดคุยมากขึ้นเกี่ยวกับภาวะเศรษฐกิจถดถอยในสหรัฐฯ ที่อาจจะเกิดขึ้น และแรงกดดันต่อ

Miroslaw Bawulski 08:18 2025-04-22 UTC+2

คำแนะนำการซื้อขายสำหรับตลาดสกุลเงินดิจิทัลในวันที่ 21 เมษายน

Bitcoin และ Ethereum ที่ใช้เวลาตลอดสุดสัปดาห์เคลื่อนไหวด้านข้างในกรอบหนึ่ง ได้พุ่งขึ้นอย่างรวดเร็วในช่วงการซื้อขายของเอเชียวันนี้ การพุ่งขึ้นนี้เกิดจากข่าวลือว่า Jerome Powell ประธานธนาคารกลางสหรัฐ (Federal Reserve) อาจถูกปลดจากตำแหน่ง ซึ่งถ้าเกิดขึ้นจริงจะเพิ่มความวุ่นวายให้กับเศรษฐกิจอเมริกาที่กำลังสั่นคลอนในขณะนี้ เรื่องนี้ทำให้ค่าเงินดอลลาร์อ่อนลงอย่างแรงและยิ่งทำลายความเชื่อมั่นของนักลงทุนในสกุลเงินดอลลาร์ หากค่าเงินดอลลาร์ยังอ่อนตัวลงเรื่อยๆ

Miroslaw Bawulski 09:03 2025-04-21 UTC+2

คำแนะนำการซื้อขายสำหรับตลาดคริปโตเคอร์เรนซีวันที่ 18 เมษายน

Bitcoin และ Ethereum ยังคงเคลื่อนตัวในกรอบด้านข้าง และการไม่สามารถทะลุออกจากกรอบเหล่านี้ได้อาจเป็นอุปสรรคต่อแนวโน้มการฟื้นตัวของตลาดคริปโตเคอร์เรนซีในวงกว้าง อย่างไรก็ตาม การขายรอบใหม่ใดๆ ก็ตามจะต้องมีเหตุผลที่หนักแน่น ซึ่งในปัจจุบันตลาดยังไม่มีเหตุผลดังกล่าว ในขณะเดียวกัน ในสุนทรพจน์เมื่อเร็ว ๆ นี้ เจอโรม พาวเวลล์

Miroslaw Bawulski 09:00 2025-04-18 UTC+2

ความสนใจใน Bitcoin และ Ethereum กำลังกลับมา

ในขณะที่ Bitcoin และ Ethereum ยังคงต่อสู้เพื่อฟื้นตัวและกลับเข้าสู่ตลาดขาขึ้น—โดยเตือนนักลงทุนและเทรดเดอร์อยู่เสมอด้วยการลดลงอย่างรุนแรงจนถึงขอบล่างของช่องทางด้านข้างที่พวกมันอยู่มาตั้งแต่เดือนเมษายน—จำนวนของเทรดเดอร์ค้าปลีกรายใหม่ที่มีศักยภาพกำลังเพิ่มขึ้นแสดงความสนใจในตลาดคริปโตเคอเรนซีมากขึ้น ตามข้อมูลการค้นหาของ Google ดัชนีการค้นหาสำหรับ "Bitcoin" ในเดือนมีนาคม 2025 อยู่ที่ระดับ 34 ซึ่งเป็นค่าสูงสุดสำหรับปีนี้ ปริมาณการค้นหาของ

Jakub Novak 06:52 2025-04-18 UTC+2

การวิเคราะห์เชิงเทคนิคของการเคลื่อนไหวราคาภายในวันของสกุลเงินคริปโต Litecoin วันพฤหัสบดีที่ 17 เมษายน 2025

หลังจากที่ประสบความสำเร็จในการทะลุออกจากรูปแบบ Ascending Broadening Wedge บนกราฟ 4 ชั่วโมงของสกุลเงินดิจิทัล Litecoin ตามมาด้วยการเกิด Divergence ระหว่างการเคลื่อนไหวของราคา Litecoin กับตัวบ่งชี้ Stochastic Oscillator

Arief Makmur 06:40 2025-04-17 UTC+2
หากไม่สะดวกคุยในตอนนี้
ระบุคำถามไว้ได้ใน แชท.
Widget callback
 

Dear visitor,

Your IP address shows that you are currently located in the USA. If you are a resident of the United States, you are prohibited from using the services of InstaFintech Group including online trading, online transfers, deposit/withdrawal of funds, etc.

If you think you are seeing this message by mistake and your location is not the US, kindly proceed to the website. Otherwise, you must leave the website in order to comply with government restrictions.

Why does your IP address show your location as the USA?

  • - you are using a VPN provided by a hosting company based in the United States;
  • - your IP does not have proper WHOIS records;
  • - an error occurred in the WHOIS geolocation database.

Please confirm whether you are a US resident or not by clicking the relevant button below. If you choose the wrong option, being a US resident, you will not be able to open an account with InstaForex anyway.

We are sorry for any inconvenience caused by this message.