signal strength 2 of 5
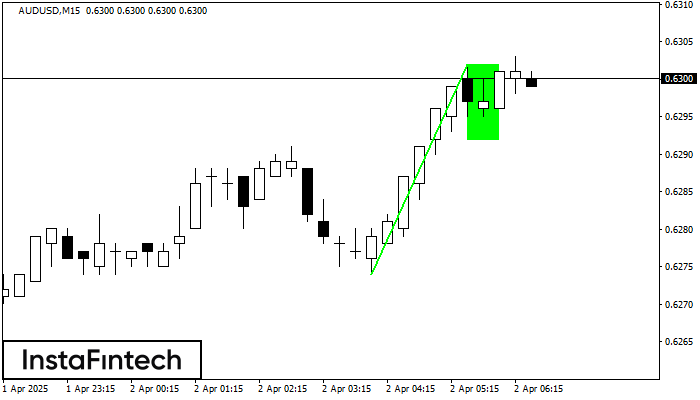
The Bullish Flag pattern has been formed on the chart AUDUSD M15 which signals that the upward trend will continue. Signals: а break of the peak at 0.6302 may push the price higher, and the rise will be the projection of the pole.
The M5 and M15 time frames may have more false entry points.
- All
- Double Top
- Flag
- Head and Shoulders
- Pennant
- Rectangle
- Triangle
- Triple top
- All
- #AAPL
- #AMZN
- #Bitcoin
- #EBAY
- #FB
- #GOOG
- #INTC
- #KO
- #MA
- #MCD
- #MSFT
- #NTDOY
- #PEP
- #TSLA
- #TWTR
- AUDCAD
- AUDCHF
- AUDJPY
- AUDUSD
- EURCAD
- EURCHF
- EURGBP
- EURJPY
- EURNZD
- EURRUB
- EURUSD
- GBPAUD
- GBPCHF
- GBPJPY
- GBPUSD
- GOLD
- NZDCAD
- NZDCHF
- NZDJPY
- NZDUSD
- SILVER
- USDCAD
- USDCHF
- USDJPY
- USDRUB
- All
- M5
- M15
- M30
- H1
- D1
- All
- Buy
- Sale
- All
- 1
- 2
- 3
- 4
- 5
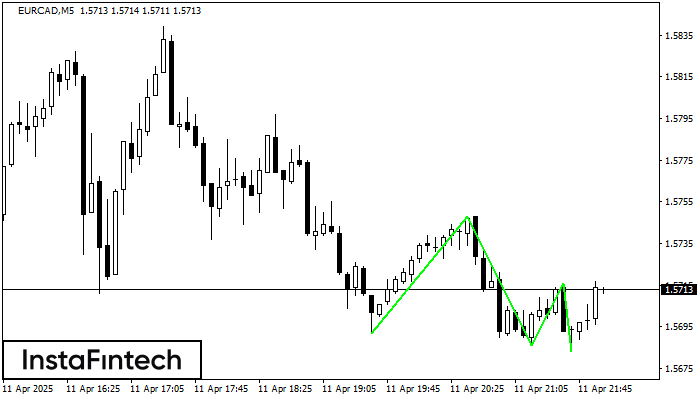
El patrón Triple Piso ha sido formado en el gráfico de EURCAD M5. Características del patrón: línea inferior del patrón tiene coordenadas 1.5748 con el límite superior 1.5748/1.5716, la proyección
Los marcos de tiempo M5 y M15 pueden tener más puntos de entrada falsos.
Open chart in a new window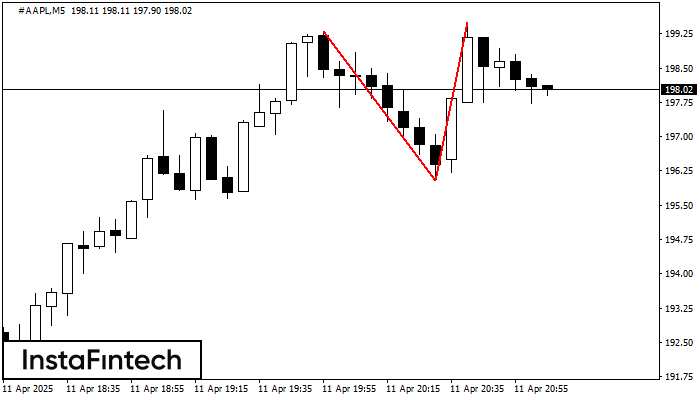
En el gráfico de #AAPL M5 el patrón de reversión Doble Techo ha sido formado. Características: límite superior 199.49; límite inferior 196.03; el ancho del patrón 346 puntos. La señal
Los marcos de tiempo M5 y M15 pueden tener más puntos de entrada falsos.
Open chart in a new window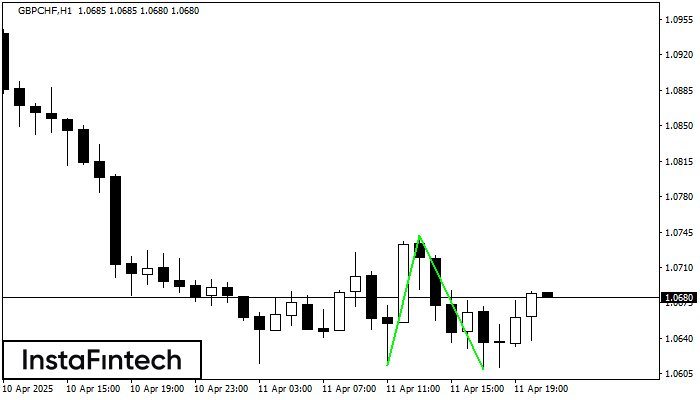
El patrón Doble Piso ha sido formado en GBPCHF H1. Características: el nivel de soporte 1.0613; el nivel de resistencia 1.0742; el ancho del patrón 129 puntos. Si el nivel
Open chart in a new window