signal strength 2 of 5
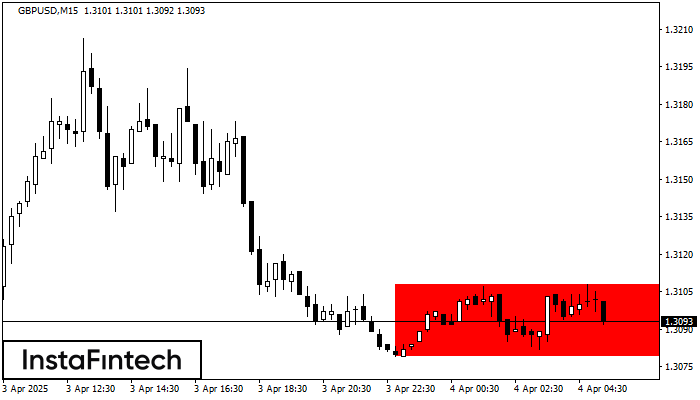
According to the chart of M15, GBPUSD formed the Bearish Rectangle. The pattern indicates a trend continuation. The upper border is 1.3108, the lower border is 1.3079. The signal means that a short position should be opened after fixing a price below the lower border 1.3079 of the Bearish Rectangle.
The M5 and M15 time frames may have more false entry points.
See Also
- All
- Double Top
- Flag
- Head and Shoulders
- Pennant
- Rectangle
- Triangle
- Triple top
- All
- #AAPL
- #AMZN
- #Bitcoin
- #EBAY
- #FB
- #GOOG
- #INTC
- #KO
- #MA
- #MCD
- #MSFT
- #NTDOY
- #PEP
- #TSLA
- #TWTR
- AUDCAD
- AUDCHF
- AUDJPY
- AUDUSD
- EURCAD
- EURCHF
- EURGBP
- EURJPY
- EURNZD
- EURRUB
- EURUSD
- GBPAUD
- GBPCHF
- GBPJPY
- GBPUSD
- GOLD
- NZDCAD
- NZDCHF
- NZDJPY
- NZDUSD
- SILVER
- USDCAD
- USDCHF
- USDJPY
- USDRUB
- All
- M5
- M15
- M30
- H1
- D1
- All
- Buy
- Sale
- All
- 1
- 2
- 3
- 4
- 5
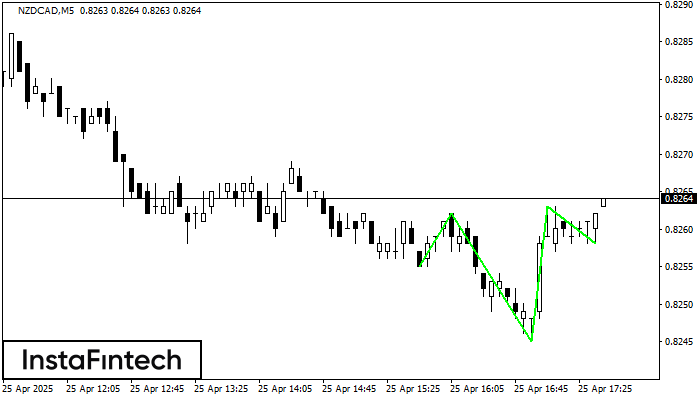
According to M5, NZDCAD is shaping the technical pattern – the Inverse Head and Shoulder. In case the Neckline 0.8262/0.8263 is broken out, the instrument is likely to move toward
The M5 and M15 time frames may have more false entry points.
Open chart in a new window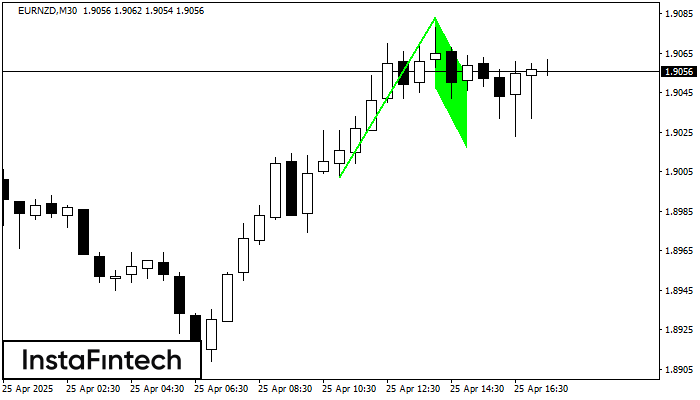
The Bullish Flag pattern has been formed on the chart EURNZD M30 which signals that the upward trend will continue. Signals: а break of the peak at 1.9083 may push
Open chart in a new window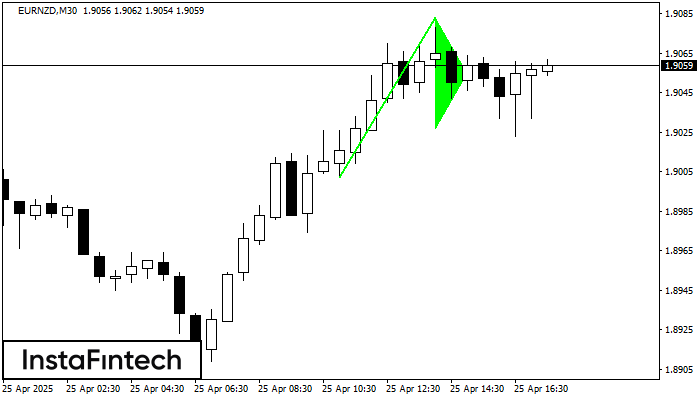
The Bullish pennant graphic pattern has formed on the EURNZD M30 instrument. This pattern type falls under the category of continuation patterns. In this case, if the quote can breaks
Open chart in a new window