empty
30.01.2025 06:56 AM
Bitcoin January 30 - Technical Analysis of the Situation

This image is no longer relevant

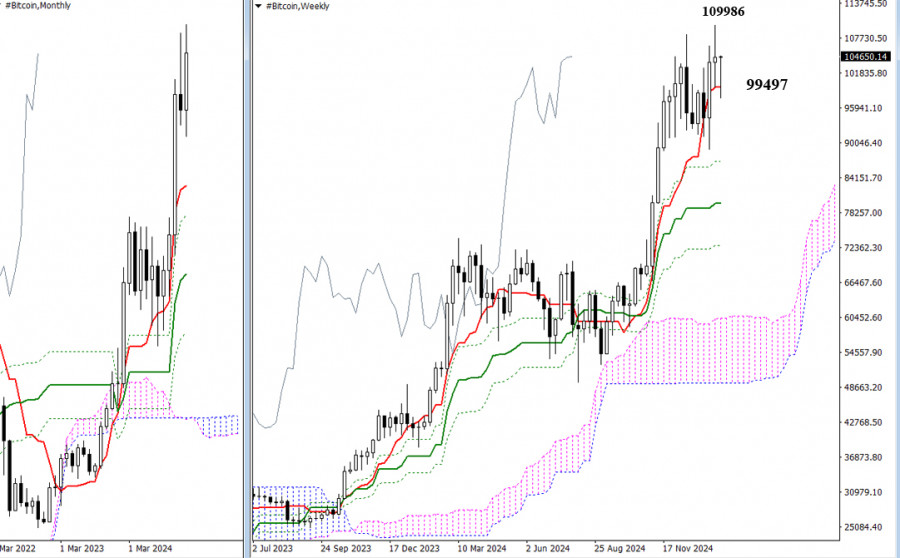
Bitcoin reached a new high last week at 109,986 but has since paused its upward movement, entering a phase of uncertainty. Currently, a long lower shadow has formed on the weekly timeframe, extending down to the short-term trend support level of 99,497. The main question now is whether the bulls will regain control and push prices higher for the remainder of the week, or if uncertainty will continue to dominate.

This image is no longer relevant

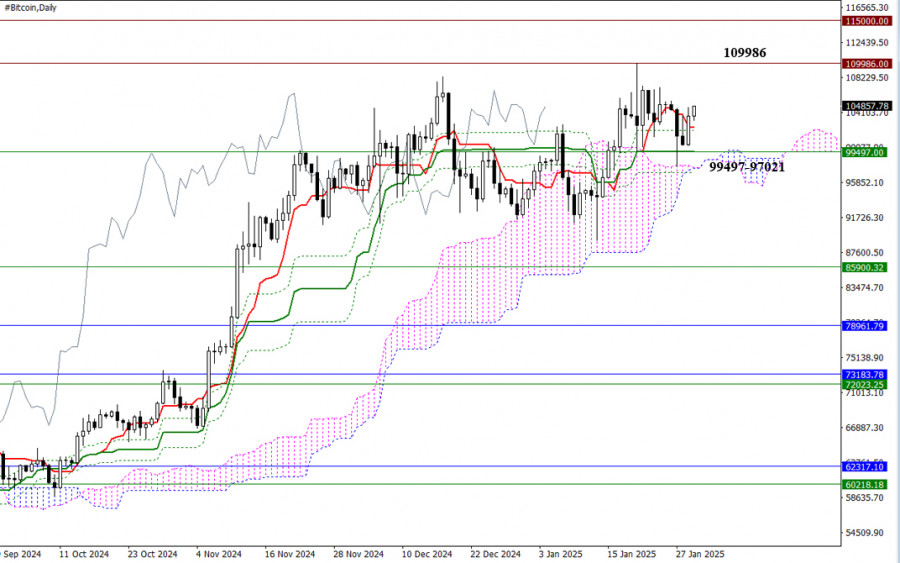
In the daily timeframe, the influence of the Ichimoku daily cross (102,383 – 99,497 – 97,021) and the daily cloud (97,538) is contributing to the ongoing uncertainty. If bearish traders manage to break through the established support levels and maintain consolidation below them, new opportunities could arise for them. Conversely, if bulls maintain control and rebound from the current support zone, they might aim to retest the previous high of 109,986 and potentially establish new peaks. In this scenario, the psychological levels of 112000, 113000, 114000, and 115000 will serve as upside targets.

This image is no longer relevant

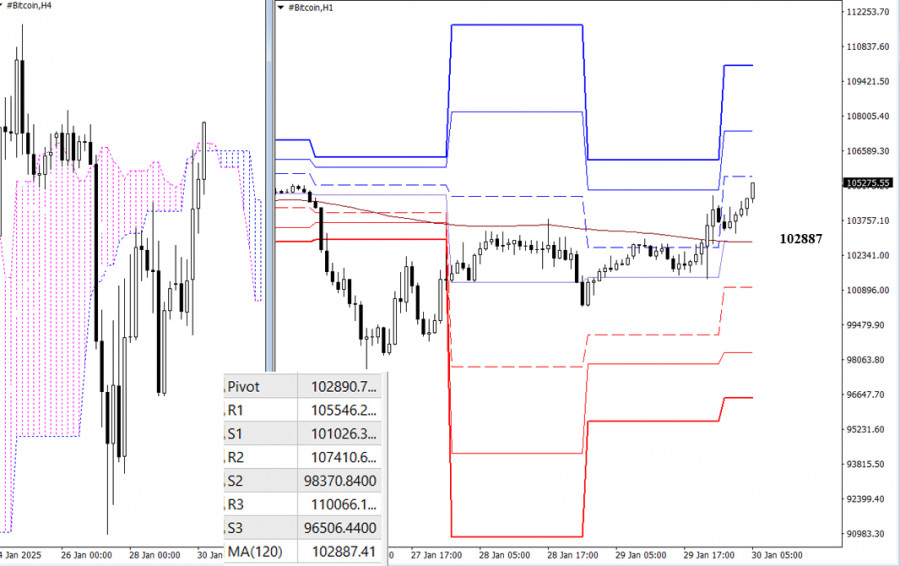
On lower timeframes, Bitcoin has successfully risen above the long-term weekly trend level of 102,887. However, the H4 Ichimoku cloud resistance, which ranges from 104,889 to 104,743, is currently limiting further growth. The key reference points for potential upward movement today are the resistance levels from the classic Pivot points, which can be identified at 105546 - 107411 - 110066. A break above the cloud would signal additional bullish momentum. Conversely, if bearish sentiment takes hold, we could see a rebound from the H4 cloud. This would bring us back to key levels, which today align in the area of 102887. Consolidation below this level, along with a subsequent reversal, would shift momentum in favor of stronger bearish sentiment. The downward reference points in this scenario would be the support levels from the classic Pivot points at 101026 - 98371 - 96506.

***

Technical Analysis Components:
  • Higher Timeframes: Ichimoku Kinko Hyo (9.26.52) and Fibonacci Kijun levels
  • H1: Classic Pivot Points and 120-period Moving Average (weekly long-term trend)
Evangelos Poulakis,
انسٹافاریکس کا تجزیاتی ماہر
© 2007-2025
ٹائم فریم منتخب کریں
5
منٹ
15
منٹ
30
منٹ
1
گھنٹہ
4
گھنٹے
1
دن
1
ہفتہ
انسٹافاریکس کے ساتھ کرپٹو کرنسی کی معاملاتی تبدیلیوں سے کمائیں۔
میٹا ٹریڈر 4 ڈاؤن لوڈ کریں اور اپنی پہلی ٹریڈ کھولیں۔
  • Grand Choice
    Contest by
    InstaForex
    InstaForex always strives to help you
    fulfill your biggest dreams.
    مقابلہ میں شامل ہوں

تجویز کردہ مضامین

اپریل 15 2025 کو یورو / یو ایس ڈی کی پیشن گوئی

پیر کو، یورو / یو ایس ڈی جوڑا مسلسل بڑھتا رہا لیکن دن کے اختتام تک 1.1318 پر 261.8% فیبوناچی ریٹریسمنٹ کی سطح پر واپس آ گیا۔

Samir Klishi 16:02 2025-04-15 UTC+2

اپریل 15 2025 کو جی بی پی / یو ایس ڈی کی پیشن گوئی

فی گھنٹہ چارٹ پر، جی بی پی / یو ایس ڈی پئیر پیر کو بڑھتا رہا اور اس نے 1.3139 کی سطح سے اوپر کی پوزیشن حاصل کی۔ اس طرح،

Samir Klishi 15:50 2025-04-15 UTC+2

اپریل 15-18 2025 کے لیے سونے (ایکس اے یو / یو ایس ڈی) کے لیے تجارتی سگنل: $3,220 سے نیچے فروخت (+1/8 مرے - 21 ایس ایم اے)

ایگل انڈیکیٹراوور باٹ سطح پر پہنچ رہا ہے، اس لیے ہم اس کی بلند ترین 3,245 سے نیچے فروخت کے مواقع تلاش کریں گے، جس کے اہداف 3,200، 3,170

Dimitrios Zappas 15:12 2025-04-15 UTC+2

Forecast for EUR/USD on April 14, 2025

جمعہ کو،یورو / یو ایس ڈی جوڑا مسلسل بڑھتا رہا لیکن دن کے دوسرے نصف حصے میں واپس چلا گیا۔ گراوٹ (یعنی ڈالر کی مضبوطی) قلیل مدتی تھی، اور جمعہ

Samir Klishi 20:30 2025-04-14 UTC+2

Forecast for GBP/USD on April 14, 2025

گھنٹہ وار چارٹ پر، جی بی پی / یو ایس ڈی جوڑے نے جمعہ کو اپنی اوپر کی حرکت جاری رکھی اور آج 1.3151 کی سطح تک پہنچنے

Samir Klishi 20:27 2025-04-14 UTC+2

اپریل 14-17 2024 کے لیے سونے (ایکس اے یو / یو ایس ڈی) کے لیے تجارتی سگنل: $3,224 سے نیچے فروخت (+1/8 مرے - 21 ایس ایم اے)

آنے والے گھنٹوں کے لیے ہمارا تجارتی منصوبہ 3,224 سے نیچے سونا فروخت کرنا ہے، جس کا ہدف 3,203 اور 3,156 ہے۔ ہمیں کسی بھی تکنیکی بحالی کے لیے چوکنا

Dimitrios Zappas 20:03 2025-04-14 UTC+2

اپریل 11-13 2025 کے لیے سونے (ایکس اے یو / یو ایس ڈی) کے لیے تجارتی سگنل: $3,235 سے نیچے فروخت (+1/8 مرے - زیادہ خریدا گیا)

ہم آنے والے دنوں میں 3,125 پر 8/8 مرے کی طرف مضبوط تکنیکی اصلاح کی توقع کر سکتے ہیں۔ دھات 3,089 پر واقع

Dimitrios Zappas 20:06 2025-04-11 UTC+2

اپریل 11-15 2025 کے لیے یورو / یو ایس ڈی کے لیے تجارتی اشارہ: 1.1470 سے نیچے فروخت (+2/8 مرے - زیادہ خریدا گیا)

یورپی سیشن کے دوران، یورو 1.1473 پر واقع +2/8 مرے کے ارد گرد ایک نئی بلندی پر پہنچ گیا۔ یورو / یو ایس ڈی میں یہ حرکت چین کی وزارت

Dimitrios Zappas 19:52 2025-04-11 UTC+2

جی بی پی / یو ایس ڈی کی پیشن گوئی برائے 11 اپریل 2025

گھنٹہ وار چارٹ پر، جی بی پی / یو ایس ڈی پئیر نے جمعرات کو اپنی اوپر کی حرکت جاری رکھی اور جمعہ کی صبح تک 1.3003 پر 127.2% اصلاحی

Samir Klishi 16:18 2025-04-11 UTC+2
ابھی فوری بات نہیں کرسکتے ؟
اپنا سوال پوچھیں بذریعہ چیٹ.
Widget callback
 

Dear visitor,

Your IP address shows that you are currently located in the USA. If you are a resident of the United States, you are prohibited from using the services of InstaFintech Group including online trading, online transfers, deposit/withdrawal of funds, etc.

If you think you are seeing this message by mistake and your location is not the US, kindly proceed to the website. Otherwise, you must leave the website in order to comply with government restrictions.

Why does your IP address show your location as the USA?

  • - you are using a VPN provided by a hosting company based in the United States;
  • - your IP does not have proper WHOIS records;
  • - an error occurred in the WHOIS geolocation database.

Please confirm whether you are a US resident or not by clicking the relevant button below. If you choose the wrong option, being a US resident, you will not be able to open an account with InstaForex anyway.

We are sorry for any inconvenience caused by this message.