signal strength 1 of 5
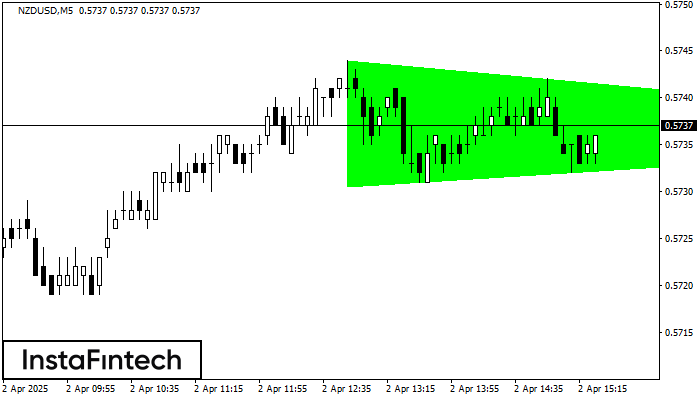
According to the chart of M5, NZDUSD formed the Bullish Symmetrical Triangle pattern, which signals the trend will continue. Description. The upper border of the pattern touches the coordinates 0.5744/0.5736 whereas the lower border goes across 0.5731/0.5736. The pattern width is measured on the chart at 13 pips. If the Bullish Symmetrical Triangle pattern is in progress during the upward trend, this indicates the current trend will go on. In case 0.5736 is broken, the price could continue its move toward 0.5751.
The M5 and M15 time frames may have more false entry points.
See Also
- All
- Double Top
- Flag
- Head and Shoulders
- Pennant
- Rectangle
- Triangle
- Triple top
- All
- #AAPL
- #AMZN
- #Bitcoin
- #EBAY
- #FB
- #GOOG
- #INTC
- #KO
- #MA
- #MCD
- #MSFT
- #NTDOY
- #PEP
- #TSLA
- #TWTR
- AUDCAD
- AUDCHF
- AUDJPY
- AUDUSD
- EURCAD
- EURCHF
- EURGBP
- EURJPY
- EURNZD
- EURRUB
- EURUSD
- GBPAUD
- GBPCHF
- GBPJPY
- GBPUSD
- GOLD
- NZDCAD
- NZDCHF
- NZDJPY
- NZDUSD
- SILVER
- USDCAD
- USDCHF
- USDJPY
- USDRUB
- All
- M5
- M15
- M30
- H1
- D1
- All
- Buy
- Sale
- All
- 1
- 2
- 3
- 4
- 5

Theo biểu đồ của M5, GBPAUD đã hình thành mô hình Tam giác Cân Tăng. Đường biên giới thấp hơn của mô hình chạm tọa độ 2.0825/2.0852 trong khi đường
Khung thời gian M5 và M15 có thể có nhiều điểm vào lệnh sai hơn.
Open chart in a new window
Theo biểu đồ của M5, AUDCAD đã hình thành mô hình Tam giác Cân Tăng. Mô tả: Đây là mô hình của sự tiếp tục xu hướng. 0.8879 và 0.8869
Khung thời gian M5 và M15 có thể có nhiều điểm vào lệnh sai hơn.
Open chart in a new window
Theo biểu đồ của M30, USDJPY đã hình thành mô hình Tam giác Cân Giảm. Mô hình này báo hiệu xu hướng giảm hơn nữa trong trường hợp đường biên
Open chart in a new window