signal strength 3 of 5
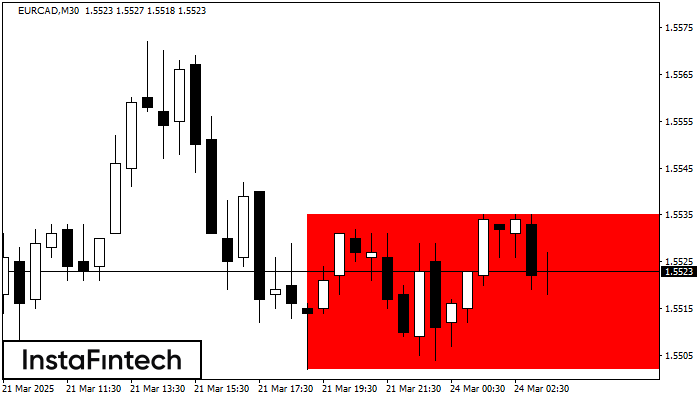
According to the chart of M30, EURCAD formed the Bearish Rectangle. The pattern indicates a trend continuation. The upper border is 1.5535, the lower border is 1.5502. The signal means that a short position should be opened after fixing a price below the lower border 1.5502 of the Bearish Rectangle.
- All
- Double Top
- Flag
- Head and Shoulders
- Pennant
- Rectangle
- Triangle
- Triple top
- All
- #AAPL
- #AMZN
- #Bitcoin
- #EBAY
- #FB
- #GOOG
- #INTC
- #KO
- #MA
- #MCD
- #MSFT
- #NTDOY
- #PEP
- #TSLA
- #TWTR
- AUDCAD
- AUDCHF
- AUDJPY
- AUDUSD
- EURCAD
- EURCHF
- EURGBP
- EURJPY
- EURNZD
- EURRUB
- EURUSD
- GBPAUD
- GBPCHF
- GBPJPY
- GBPUSD
- GOLD
- NZDCAD
- NZDCHF
- NZDJPY
- NZDUSD
- SILVER
- USDCAD
- USDCHF
- USDJPY
- USDRUB
- All
- M5
- M15
- M30
- H1
- D1
- All
- Buy
- Sale
- All
- 1
- 2
- 3
- 4
- 5
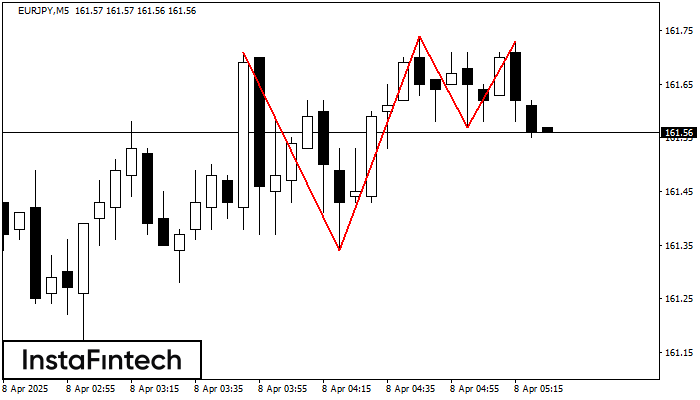
En el gráfico del instrumento de negociación EURJPY M5, se ha formado el patrón Triple Techo que señala un cambio en la tendencia. Es posible que después de la formación
Los marcos de tiempo M5 y M15 pueden tener más puntos de entrada falsos.
Open chart in a new window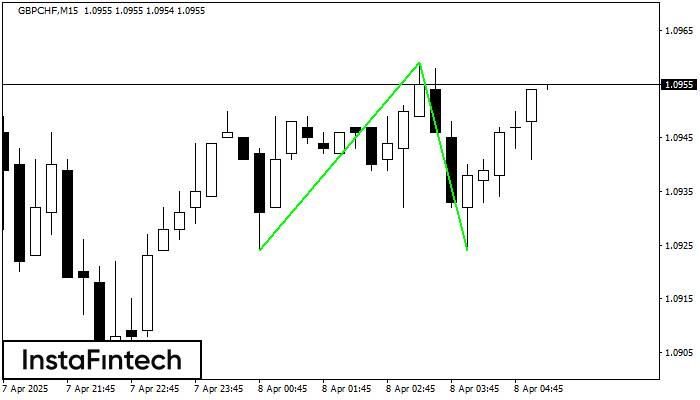
El patrón Doble Piso ha sido formado en GBPCHF M15. Características: el nivel de soporte 1.0924; el nivel de resistencia 1.0959; el ancho del patrón 35 puntos. Si el nivel
Los marcos de tiempo M5 y M15 pueden tener más puntos de entrada falsos.
Open chart in a new window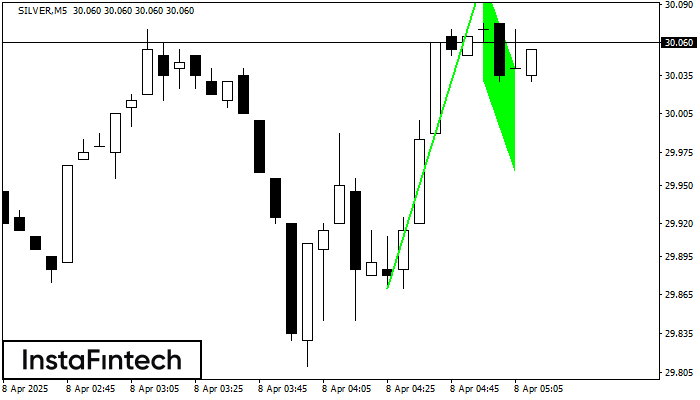
El patrón Bandera alcista ha sido formado en el gráfico SILVER M5 que señala que la tendencia alcista continuará. Señales: una ruptura del pico a 30.11 puede hacer
Los marcos de tiempo M5 y M15 pueden tener más puntos de entrada falsos.
Open chart in a new window