empty
24.01.2025 12:40 PM
Forecast for EUR/USD on January 24, 2025

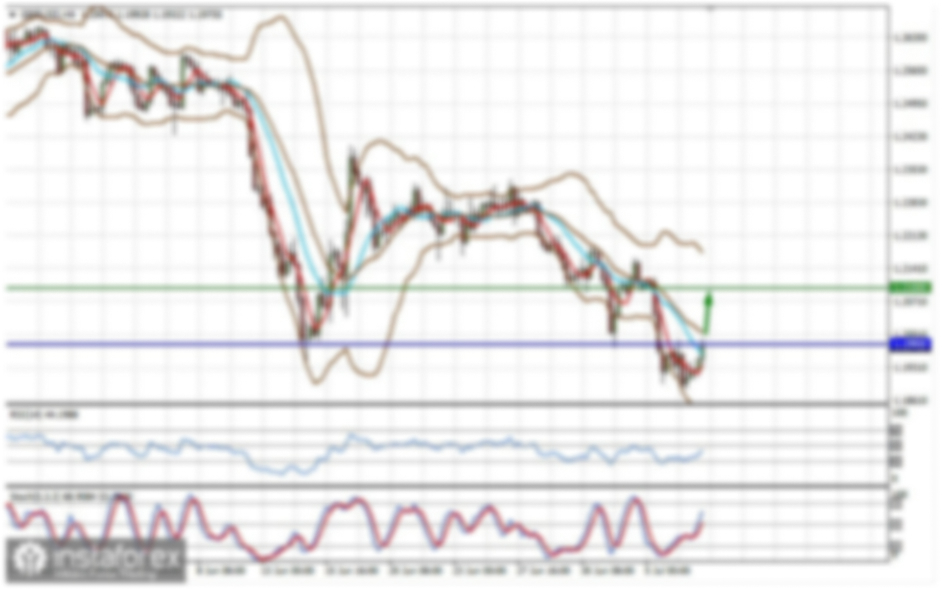
On Thursday, the EUR/USD pair rebounded from the 76.4% Fibonacci corrective level at 1.0376, reversed in favor of the euro, and secured above the 100.0% Fibonacci level at 1.0437. This indicates that the upward movement may continue toward the next corrective level of 127.2% at 1.0507. The upward trend channel continues to signal a bullish market sentiment. A decline in the euro seems unlikely in the near term.

This image is no longer relevant

The wave structure remains clear. The last completed downward wave broke the low of the previous wave, while the current upward wave has yet to surpass its previous peak. This indicates that the bearish trend is still ongoing, with no signs of a reversal. For a trend reversal to occur, the euro must rise confidently above the 1.0460 level and close above it within the current wave. This could happen as soon as today.

The economic calendar on Thursday was relatively quiet. However, Donald Trump made headlines once again with his speech at the Davos International Forum, where he delivered several bold statements. While not all of his claims are likely to materialize, his remarks often influence the market. The U.S. president stated that he will demand monetary policy easing from the Federal Reserve.

It's worth noting that Trump previously pressured the Fed during his first term, arguing that high interest rates make the dollar "too strong," which hinders U.S. exports. At the time, Fed Chair Jerome Powell resisted Trump's demands. Today, Powell remains at the helm, and it is unlikely that Trump will succeed in influencing him. Therefore, I do not expect the FOMC to cut rates in 2025 beyond what it has already planned, or beyond what inflation allows. Nonetheless, Trump's remarks prompted selling pressure on the dollar.

This image is no longer relevant

On the 4-hour chart, the pair has risen to the 127.2% Fibonacci corrective level at 1.0436 and secured above it. This suggests that the upward movement may continue toward the next Fibonacci level of 100.0% at 1.0603. Furthermore, the euro has broken above the downward trend channel, signaling a gradual shift to a bullish trend. However, the duration of this bullish trend remains uncertain.

Commitments of Traders (COT) Report

This image is no longer relevant

During the last reporting week, speculators closed 3,743 long positions and 7,470 short positions. The sentiment among the "Non-commercial" group remains bearish, indicating a potential further decline for the pair. The total number of long positions held by speculators now stands at 162,000, while short positions total 223,000.

For 18 consecutive weeks, major players have been offloading the euro. This confirms a bearish trend without any exceptions. Occasionally, bulls dominate within certain weeks, but these instances are exceptions rather than the rule. The main driver for the dollar's decline—expectations of FOMC monetary policy easing—has already been priced in, leaving the market with little reason to sell the dollar further. However, new reasons may emerge soon, potentially even this week. For now, the rise of the U.S. dollar appears more probable. Graphical analysis also supports the continuation of the long-term bearish trend, suggesting further declines in the EUR/USD pair.

Economic Calendar for the EU and the US:

  • EU: German Services PMI (08:30 UTC)
  • EU: German Manufacturing PMI (08:30 UTC)
  • EU: Eurozone Services PMI (09:00 UTC)
  • EU: Eurozone Manufacturing PMI (09:00 UTC)
  • US: Services PMI (14:45 UTC)
  • US: Manufacturing PMI (14:45 UTC)
  • US: New Home Sales (15:00 UTC)
  • US: Consumer Sentiment Index (15:00 UTC)

The economic calendar for January 24 is packed with entries, mostly focused on business activity data. The impact of the news background on market sentiment may be moderate and could manifest at various times throughout the day.

Forecast for EUR/USD and Trading Recommendations

Selling opportunities may arise if the pair consolidates below the upward trend channel on the hourly chart. Currently, there is a high probability of a bullish trend reversal. Buying opportunities were present after a rebound from the 1.0336–1.0346 zone with targets at 1.0435–1.0448, which have already been achieved. New buying opportunities may arise after further rebounds or consolidations on the hourly chart.

Fibonacci levels are plotted at 1.0437–1.0179 on the hourly chart and 1.0603–1.1214 on the 4-hour chart.

Samir Klishi,
Analytical expert of InstaForex
© 2007-2025
Select timeframe
5
min
15
min
30
min
1
hour
4
hours
1
day
1
week
Earn on cryptocurrency rate changes with InstaForex
Download MetaTrader 4 and open your first trade
  • Grand Choice
    Contest by
    InstaForex
    InstaForex always strives to help you
    fulfill your biggest dreams.
    JOIN CONTEST

Recommended Stories

GOLD. Gold Prices May Significantly Decline in the Near Future

Gold prices have recently seen a notable correction amid market expectations of the start of real negotiations between the U.S. and China on tariffs and overall trade. Treasury Secretary

Pati Gani 09:38 2025-04-24 UTC+2

Technical Analysis of Price Movement of Silver Commodity Instrument, Thursday April 24, 2025.

On the 4-hour chart, the Silver commodity instrument is visible even though its condition is strengthening where this is confirmed by the movement of the Silver price which is moving

Arief Makmur 06:18 2025-04-24 UTC+2

Technical Analysis of Price Movement of Nasdaq 100 Index, Thursday April 24, 2025.

Although on the 4-hour chart the Nasdaq 100 index is Sideways, the range is quite large so that there is still a fairly promising opportunity in the index. Currently

Arief Makmur 06:18 2025-04-24 UTC+2

Trading Signals for GOLD (XAU/USD) for April 23-25, 2025: sell below $3,333 (200 EMA - 6/8 Murray)

Our trading plan for the next few hours is to sell gold below $3,333, with targets at $3,313 and $3,291. We can buy above $3,280 with short-term targets at $3,437

Dimitrios Zappas 14:31 2025-04-23 UTC+2

Technical Analysis of Intraday Price Movement of AUD/JPY Cross Currency Pairs, Wednesday, April 23, 2025.

With the appearance of Divergence between the price movement of the AUD/JPY cross currency pair with the Stochastic Oscillator indicator and the price movement of AUD/JPY which is above

Arief Makmur 06:37 2025-04-23 UTC+2

Technical Analysis of Intraday Price Movement of Gold Commodity Instrument, Wednesday, April 23, 2025.

If we look at the 4-hour chart, the Gold commodity instrument appears to still be moving in a Bullish bias, but with the appearance of Divergence between the Gold price

Arief Makmur 06:37 2025-04-23 UTC+2

Forex forecast 22/04/2025: EUR/USD, GBP/USD, USD/JPY and Bitcoin

Useful links: My other articles are available in this section InstaForex course for beginners Popular Analytics Open trading account Important: The begginers in forex trading need to be very careful

Sebastian Seliga 10:08 2025-04-22 UTC+2

Technical Analysis of Intraday Price Movement of GBP/CHF Cross Currency Pairs, Tuesday April 22, 2025.

If we look at the 4-hour chart of the GBP/CHF cross currency pair, there are several interesting facts. First, the appearance of a Triangle pattern followed by the movement

Arief Makmur 06:58 2025-04-22 UTC+2

Technical Analysis of Intraday Price Movement of AUD/CAD Cross Currency Pairs, Tuesday April 22, 2025.

With the price movement of the AUD/CAD cross currency pair moving above the WMA (21) which has an upward slopes and the appearance of Convergence between the price movement

Arief Makmur 06:58 2025-04-22 UTC+2

Trading Signals for GOLD (XAU/USD) for April 21-25, 2025: sell below $3,422 (overbought - 8/8 Murray)

The eagle indicator has reached overbought levels. However, the metal could still reach the high around 8/8 Murray, which represents a strong barrier for gold. Below this area, we could

Dimitrios Zappas 17:23 2025-04-21 UTC+2
Can't speak right now?
Ask your question in the chat.
Widget callback
 

Dear visitor,

Your IP address shows that you are currently located in the USA. If you are a resident of the United States, you are prohibited from using the services of InstaFintech Group including online trading, online transfers, deposit/withdrawal of funds, etc.

If you think you are seeing this message by mistake and your location is not the US, kindly proceed to the website. Otherwise, you must leave the website in order to comply with government restrictions.

Why does your IP address show your location as the USA?

  • - you are using a VPN provided by a hosting company based in the United States;
  • - your IP does not have proper WHOIS records;
  • - an error occurred in the WHOIS geolocation database.

Please confirm whether you are a US resident or not by clicking the relevant button below. If you choose the wrong option, being a US resident, you will not be able to open an account with InstaForex anyway.

We are sorry for any inconvenience caused by this message.