empty
17.10.2023 05:41 AM
Trading Signals for USD/JPY for October 17-18, 2023: sell below 149.51 (21 SMA - symmetrical triangle)

This image is no longer relevant

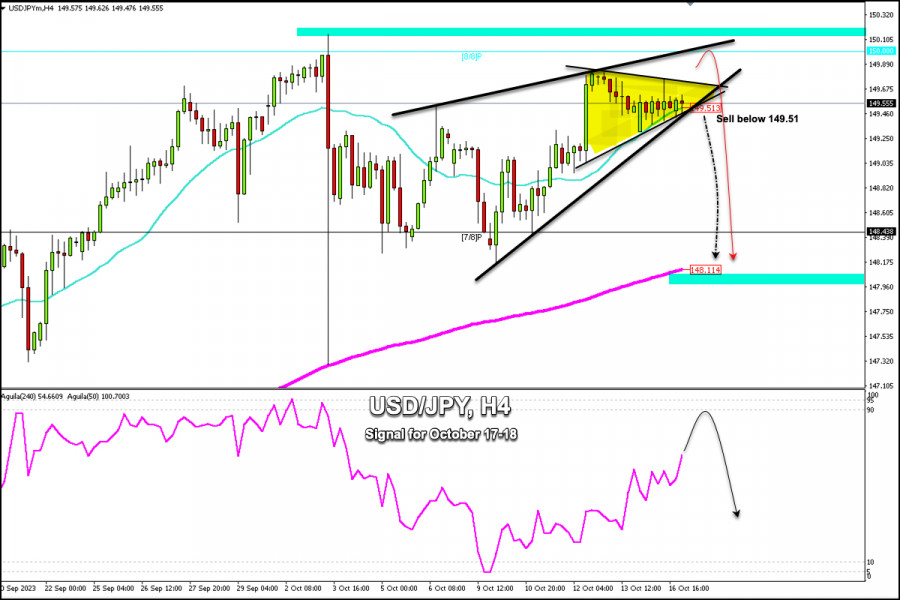
Early in the European session, the Japanese Yen (USD/JPY) is trading around 149.55 above the 21 SMA and below the 4/8 Murray. On the 4-hour chart, we can see that the Japanese yen has formed a symmetrical triangle pattern.

In the next few hours, a sharp break is expected to occur below the 21 SMA and below the uptrend channel formed since October 6.

If a bearish scenario unfolds, we should expect the Yen to trade below 149.50 and USD/JPY could reach the 200 EMA located at 148.11.

On the other hand, a bullish scenario is possible if the yen consolidates above 150.16 (Yearly High – 8/8 Murray). So, the instrument could reach +1/8 Murray at 151.56.

The main trend remains bullish for the USD/JPY pair. However, it is showing signs of exhaustion. The key for a technical correction would be to wait for the yen to fall below 149.50 to sell, with targets at 148.43 and 148.11.

In case a pullback occurs towards the psychological level of 150 and fails to break it, it will be seen as an opportunity to sell.

Dimitrios Zappas,
Analytical expert of InstaForex
© 2007-2025
Select timeframe
5
min
15
min
30
min
1
hour
4
hours
1
day
1
week
Earn on cryptocurrency rate changes with InstaForex
Download MetaTrader 4 and open your first trade
  • Grand Choice
    Contest by
    InstaForex
    InstaForex always strives to help you
    fulfill your biggest dreams.
    JOIN CONTEST

Recommended Stories

GOLD. Gold Prices May Significantly Decline in the Near Future

Gold prices have recently seen a notable correction amid market expectations of the start of real negotiations between the U.S. and China on tariffs and overall trade. Treasury Secretary

Pati Gani 09:38 2025-04-24 UTC+2

Technical Analysis of Price Movement of Silver Commodity Instrument, Thursday April 24, 2025.

On the 4-hour chart, the Silver commodity instrument is visible even though its condition is strengthening where this is confirmed by the movement of the Silver price which is moving

Arief Makmur 06:18 2025-04-24 UTC+2

Technical Analysis of Price Movement of Nasdaq 100 Index, Thursday April 24, 2025.

Although on the 4-hour chart the Nasdaq 100 index is Sideways, the range is quite large so that there is still a fairly promising opportunity in the index. Currently

Arief Makmur 06:18 2025-04-24 UTC+2

Trading Signals for GOLD (XAU/USD) for April 23-25, 2025: sell below $3,333 (200 EMA - 6/8 Murray)

Our trading plan for the next few hours is to sell gold below $3,333, with targets at $3,313 and $3,291. We can buy above $3,280 with short-term targets at $3,437

Dimitrios Zappas 14:31 2025-04-23 UTC+2

Technical Analysis of Intraday Price Movement of AUD/JPY Cross Currency Pairs, Wednesday, April 23, 2025.

With the appearance of Divergence between the price movement of the AUD/JPY cross currency pair with the Stochastic Oscillator indicator and the price movement of AUD/JPY which is above

Arief Makmur 06:37 2025-04-23 UTC+2

Technical Analysis of Intraday Price Movement of Gold Commodity Instrument, Wednesday, April 23, 2025.

If we look at the 4-hour chart, the Gold commodity instrument appears to still be moving in a Bullish bias, but with the appearance of Divergence between the Gold price

Arief Makmur 06:37 2025-04-23 UTC+2

Forex forecast 22/04/2025: EUR/USD, GBP/USD, USD/JPY and Bitcoin

Useful links: My other articles are available in this section InstaForex course for beginners Popular Analytics Open trading account Important: The begginers in forex trading need to be very careful

Sebastian Seliga 10:08 2025-04-22 UTC+2

Technical Analysis of Intraday Price Movement of GBP/CHF Cross Currency Pairs, Tuesday April 22, 2025.

If we look at the 4-hour chart of the GBP/CHF cross currency pair, there are several interesting facts. First, the appearance of a Triangle pattern followed by the movement

Arief Makmur 06:58 2025-04-22 UTC+2

Technical Analysis of Intraday Price Movement of AUD/CAD Cross Currency Pairs, Tuesday April 22, 2025.

With the price movement of the AUD/CAD cross currency pair moving above the WMA (21) which has an upward slopes and the appearance of Convergence between the price movement

Arief Makmur 06:58 2025-04-22 UTC+2

Trading Signals for GOLD (XAU/USD) for April 21-25, 2025: sell below $3,422 (overbought - 8/8 Murray)

The eagle indicator has reached overbought levels. However, the metal could still reach the high around 8/8 Murray, which represents a strong barrier for gold. Below this area, we could

Dimitrios Zappas 17:23 2025-04-21 UTC+2
Can't speak right now?
Ask your question in the chat.
Widget callback